

Peter Booth ? I'm assuming that we're discussing the response times of real production systems though the following is also applicable to load test results.
I routinely trac both median and 90% values, and on some occasions also look at the 10% percentile. Response times aren't normally distributed, so mean and standard deviation can be quite misleading.
The median is a useful measure for "typical experience" and is perhaps better understood than 90th percentile for most audiences. For many purposes the 90% is a "better" metric, though less familiar, and here's why:
Imagine we are tracking the response time of a web service over time, and we deploy some new code, how can we see if the new code impacts performance? The values that we measure will vary, and part of that variation is measurement error. If our change did cause a consistent change to response times, the size of the change will tend to be larger at the 90% percentile than the median, so we can distinguish it quicker.
The 10% percentile can be a useful measure of the best case response time, and, depending on workloads, the actual service time of the service.
All three metrics are useful and they are often driven by different factors- its useful to view scatter plots of actual data points which can highlight things like bimodal response times, periodicities, and absolute shifts in response times.
Manzoor Mohammed ? I normally look at a number of measures, including average, 90 percentile, standard deviation especially when looking at test results or a system I'm not familiar with. I think looking at a single metric only tells you part of the story while looking at a range of measures will give you a better feel of the distribution. If your familiar with a system you could get away at looking at averages and only look at the other metrics when you see an unusual deviation from the typical average response times.
Michael Brauner ? It is nice to know that people vary in what they look at with response times but what about other measures from the application that can and do contribute to the response times that you see. How about the backends that you are dependent upon or the connections pools for starters... :-)
Weifeng Tang ? I am confused here about your "big spikes in our test, use 90% percentile".
If 90% is meaningful, it means the spike affect less than 10% for your result. Thus you can eliminate the spike by ignore the 10%.
However, if the spike renders Median Response Time unmeaning, the number of spike may be much larger than 10%. Otherwise, since the Median the data on the 50% position, even the whole 10% is on one direction, the Median might be at 60% position(Actually, 55% or 45% if we think all these data are abnormal). In a real production environment, I would not expect a 50% --> 60% position will generate big difference that could make the test nonsense. Specially, the position change is happened in the center of curves. Unless your system falls into some very strange behavior.
Weifeng Tang ? I think Median or 90% are both OK to rep your test if your tested application is error free. Both of them get rid of the spikes and better than Average.
However, the strange spikes ( not one) in the middle of the execution seems problematic. It might be some resource competition at that time or pool expansion that incurred this point. Though performance curves are not expected to be normal, yet I always try to find a stable curve. I'll doubt myself if need present this result to my client. Anyway I have no knowledge of your circumstance, you may have your own limitations or assumptions to do so.
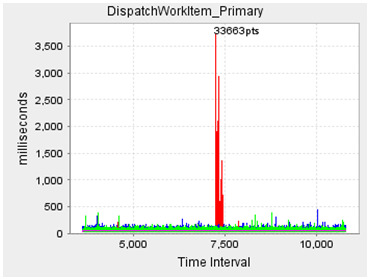
Peter Booth ? Can you add some detail to this data? Is the response time curve a scatterplot of every response time with the horizontal axis being the number of datapoints? How long was your test run? Did it show a spike of 3.5seconds during the test?
What are the three columns on the percentile table showing? Is this milliseconds or seconds? Are these percentiles with and without outliers? Is it the result of only a single test run?
Peter Booth ? Feng,
Some comments on the data:
1. Obviously the large spike that appears in one of the test runs is an issue. Does it represent usual behavior (say a full GC cycle) or a one-off issue?
2. The individual data points are in the tens of milliseconds. What is the request rate of the test workload?
3. Are these dynamic web requests?
4. Are you familiar with hypothesis testing, significance, and the statistical power of test designs? You can get more information from 54x 10 minute tests than 3x 3 hr tests, and will be able to see whether your results are consistent.
Peter Booth ? Right now you have a few long-lived test runs at a modest request rate (33 req/sec), and they show that most requests are served within 30 to 40 ms. If we ignore the spike and use the median response time of 33ms as an estimate of response time, then Little's Law implies there will be on average 33*(2000/60) / 1000 = 1.11 requests in the system at any time. Thats a pretty small number.
If it were me, I'd want to begin measuring performance under a trivially small workload (1 or 2 requests per second) . First thing is to look at a scatter plot of response times - are there any obvious trends? banding? cycles? I would want to estimate the EJB service time. Does your DB also expose transaction response times / AWR reports or similar? If not, I'd want to use a tool like NewRelic to capture and cross reference the DB performance against EJB performance.
I'd want to run a large number of short test runs to see if the performance numbers are consistent from run to run. I'd probably use a shell script to run tests using wrk or httperf and, after measuring the best-case EJB performance under a light load, would go onto measure the performance as workload increases, using autoperf or similar. I'd be measuring median, 90th % and 10% values. For this my goal would be to quantify scalability using the approach described http://www.perfdynamics.com/Manifesto/USLscalability.html or http://www.percona.com/files/white-papers/forecasting-mysql-scalability.pdf
No comments:
Post a Comment