Monday 29 April 2013

Performance Troubleshooting Process

What

Get the whole picture of system , get a direction to anayze base on experience

What's the issue?What's the business? Which product components be used? How much the workload?


Reproduciable or not?


Reproduciable?Get the steps of reproduce


Can't reproduceKeep watching and collect required loggs


Suggestion: monitor method or tuning ,try to find the regular pattern

Environment Information?


Component structureplatform/HA/Cluster


Vendor & VersionsAny known issue of other products


Bussiness data modelData distribution


External servicesAny backend service : webservice

Contact informationEmail&Phone

Follow up Space1. Easy To follow next actions 2. Archive history work1. new Email thread 2. new one forum thread to discussion1.Notes 2. Lotus connection forum of community
Why
To know current action ,and know what's the next base on different result by tools

Reproduce issue in local or product base on steps from customer


In LocalCost consideration (new or reuse), simulate business and data model


In Customer1. Give guide to reproduce and collect required information 2. Get access information (host/user/pwd) , do backup firstly

Issue Pattern


Always/Sometimes1. Always: resource shortage, need to monitor system resource usage. 2. Sometime: workload(hardware resource shortage or poor design) or time range(business or backend tasks).


Single User/Multiple User1. Single : profile every tier cost to locate bottleneck 2. Multiple : check appserver/db pool usage (thread/connection…)

High Resource usage


High CPU1. Using OS tools to monitor which process cost CPU 2. What's the incomming requests 3. Frequency GC1.nmon 2. GCMV 3.perfmon


CrashWhich process causevmstat iostat

High Response Time or low throughput


Functions/operationsTo confirm the functions pattern 1.one. Find which one function slow, to know the business logic or backend service. 2. Some functions, they are simillar or not (retrieve / create ….) 3 all functions , to monitor system resource


Isolate the logic tiers1. Custom API testing log time to confirm the issue of product or custom application 2. Using system performance tool to monitor all system resource usage to confirm which tier is bad 3. Check log to find any time1.qatool 2.nmon 3.perfmon/


Isolate the function module1. Profiling tool by single user. 2. Check trace log, apply for test env with single user.1.Jprofiler 2.WAS PMI 3.WAS Performance tuning toolkit

Goals


customerDiscuss with custom to confirm a goal base on business


commonSet a common goal base on industry standard
How
To give different solution base on skills and resources

CPU


High1. add CPU


LowLess network roundtrip

Memory


wrap1. increase memory 2. increase heap size

Disk


Busy1. RAID 2. less write logiciostat/perfmon

Network

App server


GC1. GC policy 2. Heap Size


Cache1. increase cache size


Pool limit1. increase pool size : thread pool/ data source

DBSnapshot SQL Explain


Buffer pool


Poor Index

Bad Design ,need a workaround


Bad index


Load too much at one page
Summarize
Growth

PersonalSkill Improvement1. Technical skill ,which knowledge is new ,to learn it 2. Troubleshooting skill ,experience improvement

CustomerBest practise for other customers1.To design solution for other customers or resolve same problem 2. Base current customer env ,give some suggestion to system stable.

ProductDesign suggestion1.Analyze the reason of the issue,any possible to redesign the product? 2. Analyze why it doesn't be test? 3. Give a suggestion to improve product monitor
Issue pattern:
Means: a. system resource limitation. b. bad logic.

  1. Always there (Means some resource is not enough)
    1. Single User? (To locate which tier consume the most time. Need profiling tool to figure out.)
      • AppServer profiling tool
      • JVM profiling too
      • Trace log
      • Application debug log
    2. Multiple Users? To locate the bottleneck
      • AppServer
        • Thread pool
        • Data source
        • Cache
      • Database
        • Agents limitation
        • Locks
        • Buffer pool limitation
    3. System resource limitation
      • High CPU
      • Memory
      • Disk I/O
      • Network
      • JVM(Optional)
      • Application Performance Data (to check application logic)
  2. Sometimes
    • Check what's functional work doing at that time
      • Batch operation
      • Backup operation
      • Migration operation
      • Cache refresh
    • Check any outside factors effection
  3. Percific functions (Need to know the application logic and relative DB operations)
    1. Authentication
    2. Create
    3. Update
    4. Delete
    5. Search
    6. Retrieve

How to see percentile?


Peter Booth ? I'm assuming that we're discussing the response times of real production systems though the following is also applicable to load test results. 

I routinely trac both median and 90% values, and on some occasions also look at the 10% percentile. Response times aren't normally distributed, so mean and standard deviation can be quite misleading. 

The median is a useful measure for "typical experience" and is perhaps better understood than 90th percentile for most audiences. For many purposes the 90% is a "better" metric, though less familiar, and here's why: 

Imagine we are tracking the response time of a web service over time, and we deploy some new code, how can we see if the new code impacts performance? The values that we measure will vary, and part of that variation is measurement error. If our change did cause a consistent change to response times, the size of the change will tend to be larger at the 90% percentile than the median, so we can distinguish it quicker. 

The 10% percentile can be a useful measure of the best case response time, and, depending on workloads, the actual service time of the service. 

All three metrics are useful and they are often driven by different factors- its useful to view scatter plots of actual data points which can highlight things like bimodal response times, periodicities, and absolute shifts in response times.


Manzoor Mohammed ? I normally look at a number of measures, including average, 90 percentile, standard deviation especially when looking at test results or a system I'm not familiar with. I think looking at a single metric only tells you part of the story while looking at a range of measures will give you a better feel of the distribution. If your familiar with a system you could get away at looking at averages and only look at the other metrics when you see an unusual deviation from the typical average response times.

Michael Brauner ? It is nice to know that people vary in what they look at with response times but what about other measures from the application that can and do contribute to the response times that you see. How about the backends that you are dependent upon or the connections pools for starters... :-)

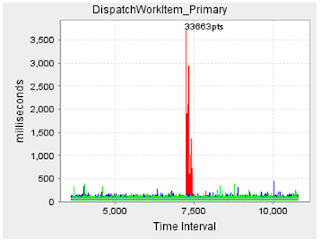
Weifeng Tang ? I am confused here about your "big spikes in our test, use 90% percentile". 

If 90% is meaningful, it means the spike affect less than 10% for your result. Thus you can eliminate the spike by ignore the 10%. 

However, if the spike renders Median Response Time unmeaning, the number of spike may be much larger than 10%. Otherwise, since the Median the data on the 50% position, even the whole 10% is on one direction, the Median might be at 60% position(Actually, 55% or 45% if we think all these data are abnormal). In a real production environment, I would not expect a 50% --> 60% position will generate big difference that could make the test nonsense. Specially, the position change is happened in the center of curves. Unless your system falls into some very strange behavior.

Weifeng Tang ? I think Median or 90% are both OK to rep your test if your tested application is error free. Both of them get rid of the spikes and better than Average. 

However, the strange spikes ( not one) in the middle of the execution seems problematic. It might be some resource competition at that time or pool expansion that incurred this point. Though performance curves are not expected to be normal, yet I always try to find a stable curve. I'll doubt myself if need present this result to my client. Anyway I have no knowledge of your circumstance, you may have your own limitations or assumptions to do so.

Peter Booth ? Can you add some detail to this data? Is the response time curve a scatterplot of every response time with the horizontal axis being the number of datapoints? How long was your test run? Did it show a spike of 3.5seconds during the test? 

What are the three columns on the percentile table showing? Is this milliseconds or seconds? Are these percentiles with and without outliers? Is it the result of only a single test run?

Peter Booth ? Feng,

Some comments on the data:

1. Obviously the large spike that appears in one of the test runs is an issue. Does it represent usual behavior (say a full GC cycle) or a one-off issue?
2. The individual data points are in the tens of milliseconds. What is the request rate of the test workload?
3. Are these dynamic web requests?
4. Are you familiar with hypothesis testing, significance, and the statistical power of test designs? You can get more information from 54x 10 minute tests than 3x 3 hr tests, and will be able to see whether your results are consistent.

Peter Booth ? Right now you have a few long-lived test runs at a modest request rate (33 req/sec), and they show that most requests are served within 30 to 40 ms. If we ignore the spike and use the median response time of 33ms as an estimate of response time, then Little's Law implies there will be on average 33*(2000/60) / 1000 = 1.11 requests in the system at any time. Thats a pretty small number. 

If it were me, I'd want to begin measuring performance under a trivially small workload (1 or 2 requests per second) . First thing is to look at a scatter plot of response times - are there any obvious trends? banding? cycles? I would want to estimate the EJB service time. Does your DB also expose transaction response times / AWR reports or similar? If not, I'd want to use a tool like NewRelic to capture and cross reference the DB performance against EJB performance. 

I'd want to run a large number of short test runs to see if the performance numbers are consistent from run to run. I'd probably use a shell script to run tests using wrk or httperf and, after measuring the best-case EJB performance under a light load, would go onto measure the performance as workload increases, using autoperf or similar. I'd be measuring median, 90th % and 10% values. For this my goal would be to quantify scalability using the approach described http://www.perfdynamics.com/Manifesto/USLscalability.html or http://www.percona.com/files/white-papers/forecasting-mysql-scalability.pdf