Tuesday, 22 April 2014

Bad response time

Bad response time : over second.
Bad throughput : 50%

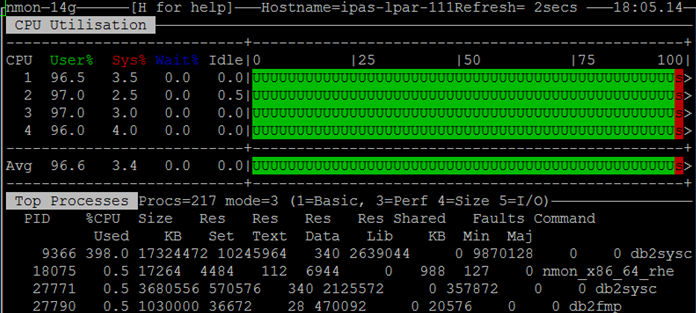
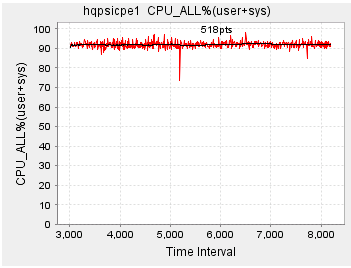
Checked the system resource, found the server's CPU is very high ~90%.
 This application is run on java platform, then check GC log, and found the GC pause is too high as:
Why? the heap size is small?
Monday, 21 April 2014

Does it always mean memory leak?

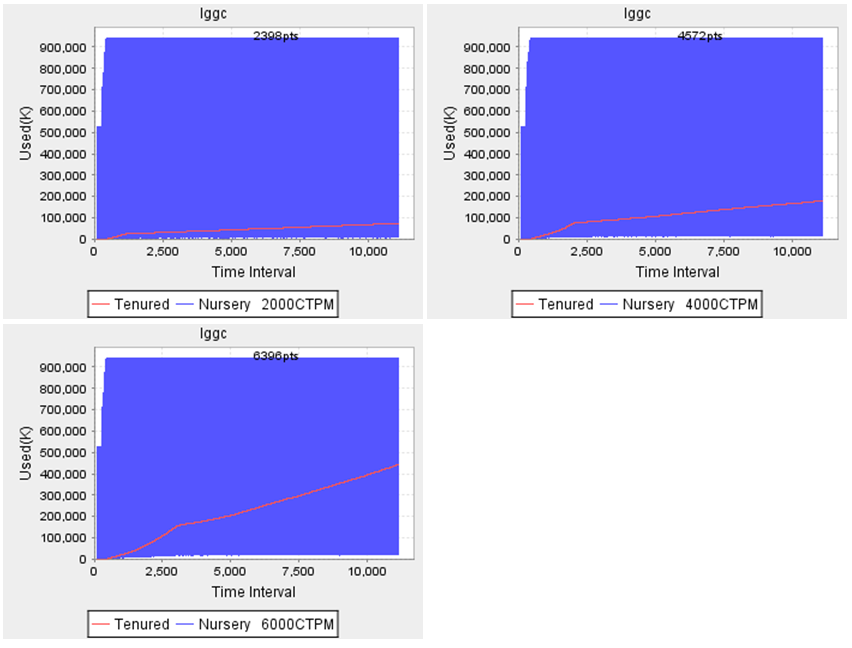
As the chart, the red line is tenured GC, blue line is nursery GC, we can see a up trend of red line, does it mean memory leak?


Thursday, 10 April 2014

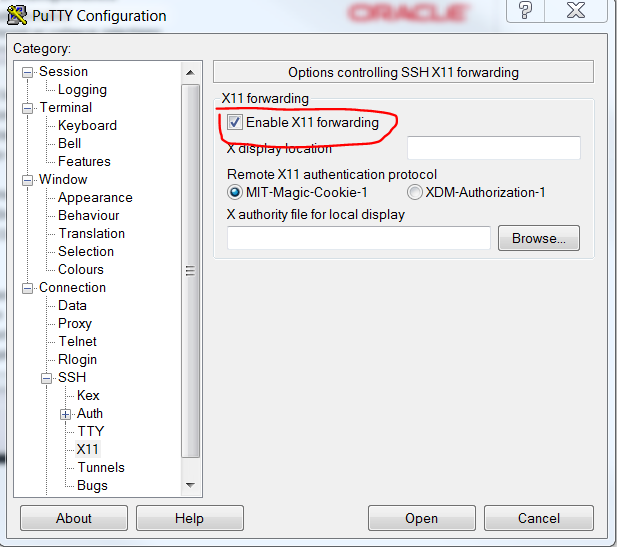
How to use Xming + Putty

  1. start Xming by default
  2. open Putty
    1. session : SSH 
    2. conection:SSH->X11 , checked below 


Monday, 16 December 2013

IBM installation manager jvm terminated exit code 13

During install IBM Installation Manager, got this error "jvm terminated exit code 13", checked the jvm version,it's right, then grant all sub-folder with execution permission, then it work!
At first I just did "chmod +x *" for current folder, it should be executed as " chmod -R +x *"

Thursday, 21 November 2013

What's factors will cause weird cpu usage?

  • We have a performance test tool we owned, which written by java. Recently I run three tests with 200/400/600 threads, and found the system CPU usage as the chart: (red-200,blue-600,green-400). I can't explain what factors will cause this kind of result, any ideas?
The GC activities are normal:

CPU Usage increasing on redhat5.4 platform
                                            It's fine on redhat6.0
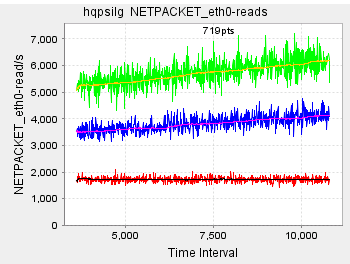
                                          netpackage also increasing.