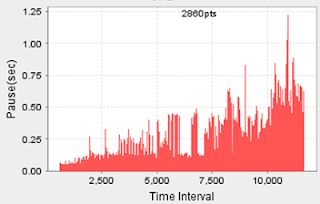
This is a 3 hours test, got these charts from GC log.
Andreas Kral ? I would rather go for the heap used then the GC pauses..
Plot the gc graph and make a line at the beginning low and a line at the right end low after the last full GC. Measure the gap in MB or GB,then get a tool like yourkit and find the class that fits closest to the gap.
Peter Booth ? Maybe. It depends on your context. A memory leak in Java is a situation where your code is retaining references to objects that are no longer needed, and so the garbage collector doesn't collect those objects.
What are the JVM startup arguments?
Your GC usage graph looks similar to what we see when an app is started with an Xms value lower than the Xmx, and so begins with a small heap size, and periodically resizes the heap (increases it.) Can you produce a chart that clearly marks the Full GC events?
If you continue to drive realistic traffic at your app does the upward trend in heap usage continue, or does it stabilize? Are the JVM settings used here similar to real world production settings for this app? Is the traffic similar to real world traffic?
Also, the other chart shows GC pauses of over 1 second. For a batch oriented system this might be unimportant, whereas for an internet based web app this is probably unacceptable. Is this an issue in your situation?
I ask these questions because this isn't a black and white question- you can have an app that is memory hungry and has a GC profile identical to your chart, but which quickly plateaus. If your heap is sized too low then this would provoke an OutOfMemoryError and fail, but with the right sized heap would perform OK.
Oleg Gusak ? The other thing to know is what garbage collector your app uses. For parallel collector plotting old gen size after Full GC over time would tell you if size of live object in old gen is growing - and that would indicate a memory leak.
Reddy Sravan ? There are two issues in your case. The memory is not enough for the amount of load u are running, this will be identified from GC pauses graph, the pause time increasing along the test
This memory unavailability will impact several things, Heap, logging, CPU etc
I also see the used memory graph, bottom end is increasing i,e GC is retaining objects inside memory which could be due to heap being low or a memory leak
There is two ways to analyze from here
1) take stderr logs and look for GC application failures and how much free nursery vs tenured (if not enough try increasing heap size and run test again)
2) take heap dumps and look for any objects staying in memory and growing over time, talk to developer to resolve the issue
Satyanarayana Murty Pindiproli ? Agree with peter and Sravan. Though analyzing heap dumps will take a long time to identify the culprit objects if there really is a leak. It could be caching as well in application which is causing these objects to be reatined. So its application specific. I would suggest taking heap histograms after specific time intervals and compare those to see which objects are increasing. Use the Heap dump to look for the reference graphs and your developers should be able to fix it. Also take a look at Perm Size for the Applications. If that is getting filled up quickly; that results in collections too. Proper resizing for perm size will help. If the GCs are minor collections then you shouldnt have a problem with memory leak , but if they are full collections on tenured then yes , you are promoting and need to address that.
Peter Booth ? The easiest way to detect the cause of a memory leak is with the Eclipse Memory Analyzer toolkit. Run your app with one of XX:+HeapDumpOnOutOfMemoryError or
-XX:+HeapDumpOnCtrlBreak and trigger a heap dump, then open the hprof file with MAT and you will be able to see the cause of heap growth.
Satyanarayana Murty Pindiproli ? I think it may not be not easy to trigger so much of traffic on the development environment. Probably using the same switches on the test evnvironment would help easily identify. App Memory requirements seem to low anyways, so he can run this in dev environment ..
Sun:
Ran a longer test ~15hours
Satyanarayana Murty Pindiproli ? I think the Charts can be explained ; but only you can confirm. The use of 2GB during the initial 6 hours mean that there are garbage objects are already in the Tenured Generation. Probably Weblogic or ap startup creating all these objects. After around 6 hours, further promotion or the nature of the VM Switches did cause a Full GC. The drop in Memory Usage for Tenured is significant which shows you had a lot of grbage objects in the Tenured in the first place. If you look at the heap stats for the remaining time duration it shows somewhere in the 750 Meg - 1Gig range which is what your application typically needs. I think triggering a Full GC on the VM before the Test would be a good idea. The drop in rate i believe is due to the Full GC ; which again picks up as soon the GC is completed. If you look at the Promotions pattern in the Log files and Map it , i am sure it will line up with a spike near the time of Full GC. I do not think you have a memory leak[ Tenured Generation doesnt go up after GC ] , a memory leak would show an increasing Tenured Generation as the Objects keep piling up.


